Calculating phonon spectra for ferromagnetic iron
Purpose: Introduces the use of CASTEP for calculating phonon spectra using the finite difference formalism.
Modules: Materials Visualizer, CASTEP
Time: 
Prerequisites: Predicting the lattice parameters of AlAs from first principles,
Predicting the thermodynamic properties of germanium
Background
Phonons are an important concept in solid state physics, which provides access to a wide range of important properties such as specific heat, thermal expansion, heat conduction, electron-phonon interactions, resistivity, and superconductivity. Density Functional Theory (DFT) methods are able to predict such properties, and CASTEP provides the necessary functionality. There are two main approaches in lattice dynamics calculations: density functional perturbation theory (DFPT) and the finite displacement method. The first is generally faster and more accurate, but its implementation is problematic and is subject to a set of restrictions. Currently, DFPT in CASTEP can only be used for norm-conserving pseudopotentials. So phonon calculations with efficient ultrasoft pseudopotentials can only be carried out by using the finite displacement algorithm.
Introduction
In this tutorial, you will learn how to use CASTEP to perform a finite displacement calculation to obtain the phonon dispersion and density of states for a magnetic metal.
This tutorial covers:
- Getting started
- To optimize the structure of the iron cell
- To calculate phonon dispersion and density of states (DOS)
- To display phonon dispersion and density of states
In order to ensure that you can follow this tutorial exactly as intended, you should use the Settings Organizer dialog to ensure that all your project settings are set to their BIOVIA default values. See the Creating a project tutorial for instructions on how to restore default project settings.
Begin by starting Materials Studio and creating a new project.
Open the New Project dialog and enter Fe_phonon as the project name, click the OK button.
The new project is created with Fe_phonon listed in the Project Explorer.
Begin by importing the Fe structure, which is included in the structure library provided with Materials Studio.
Select File | Import... from the menu bar to open the Import File dialog. Navigate to Structures/metals/pure-metals and select Fe.xsd. Click the Open button.
It is often possible to decrease the calculation time by converting the structure to a primitive cell.
Select Build | Symmetry | Primitive Cell from the menu bar.
The primitive cell of iron is displayed.
2. Optimizing the structure of iron
Now optimize the geometry of the Fe structure using CASTEP.
Click the CASTEP button  on the
Modules toolbar and choose Calculation or select Modules | CASTEP | Calculation
from the menu bar.
on the
Modules toolbar and choose Calculation or select Modules | CASTEP | Calculation
from the menu bar.
This opens the CASTEP Calculation dialog.
On the Setup tab, change the Task from Energy to Geometry Optimization, set the Quality to Fine, and the Functional to LDA. Set the Spin polarization to Collinear and uncheck the Use formal spin as initial checkbox. Set the Initial spin value to 2.
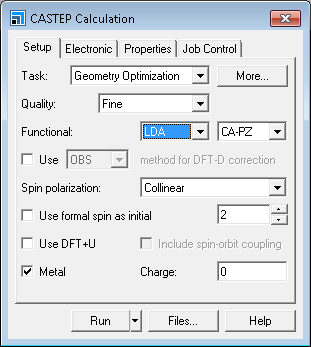
CASTEP Calculation dialog, Setup tab
The default values for geometry optimization do not include optimization of the cell.
Click the More... button to open the CASTEP Geometry Optimization dialog,
select Full from the Cell optimization dropdown list and close the dialog.
On the Electronic tab select OTFG ultrasoft from the Pseudopotentials
dropdown list.
On the Job Control tab, select the Gateway location for the job.
Click the More... button to open the CASTEP Job Control Options dialog, uncheck
all of the options in the Live updates section, and close the dialog.
Click the Run button to start the job.
If you are running this calculation on a cluster with a large amount of RAM (for example more than 10 GB in total) you should use Speed for the Runtime optimization.
When the job has completed the results are placed in a new folder called Fe CASTEP GeomOpt.
3. To calculate phonon dispersion and phonon density of states (DOS)
In order to calculate the phonon dispersion and phonon density of states you have to perform a single point energy calculation, with the appropriate properties selected for calculation.
Ensure that Fe.xsd in the Fe CASTEP GeomOpt folder
is the active document.
On the Setup tab on the CASTEP Calculation dialog, set the Task to Energy.
On the Properties tab, check the Phonons checkbox and request both density
of states and dispersion by selecting the Both radio button. Uncheck the Calculate LO-TO
splitting checkbox and choose Finite displacement from the Method dropdown list.
The finite displacement scheme has been designed for use with metallic and spin-polarized systems (as well as for calculations that make use of efficient ultrasoft potentials). This is ideal for calculating phonon properties for ferromagnetic iron.
Click the More... button to open the CASTEP Phonon Properties Setup dialog. Ensure that the Method is Finite displacement. Choose One large supercell from the Use dropdown list. Set the Supercell defined by cutoff radius to 3.5 Å. Set the Quality for both Dispersion and Density of states to Fine and close the dialog.
The cutoff radius chosen is a crucial parameter for a finite displacement calculation. The accuracy is higher when a larger cutoff radius is used, as longer range interactions are taken into account. The computational time, however, grows very rapidly with the increase of this value. For practical reasons, in this tutorial, a small value is chosen for this parameter. The convergence of the phonon frequencies as a function of the cutoff radius should be investigated when performing meaningful calculations.
On the Job Control tab select a Gateway for the calculation.
Click the More... button to open the CASTEP Job Control Options dialog and check all of the
Live updates options and close the dialog.
Click the Run button and close the CASTEP Calculation dialog.
The job is submitted and starts to run. A new folder, named Fe CASTEP Energy, is created in the Fe CASTEP GeomOpt
folder. When the energy calculation is finished the new results files are placed in this folder, including
Fe_PhonDisp.castep and Fe_PhonDOS.castep.
If you decide not to wait for the job to finish, you can access pre-computed version of these files as follows.
Use the Windows File Explorer to navigate to the share\Examples\Projects\CASTEP directory, from the top level of your Materials Studio installation. Double-click on the file Fe_phonons.stp.
For Windows users who are not administrators, you should copy the Fe_phonons.stp project and associated Fe_phonons_Files folder to a location where you have write permissions. Then open the new copy of the Fe_phonons.stp project.
4. To display phonon dispersion and density of states
Phonon dispersion curves show how phonon energy depends on the q-vector, along high symmetry directions in the Brillouin zone. This information can be obtained experimentally from neutron scattering experiments on single crystals. Such experimental data are available for only a small number of materials, so theoretical dispersion curves are useful both for establishing the validity of a modeling approach and to demonstrate the predictive power of ab initio calculations. In certain circumstances it is possible to measure the density of states (DOS) rather than the phonon dispersion. Furthermore, the electron-phonon interaction function, which is directly related to the phonon DOS, can be measured directly in the tunneling experiments. It is therefore important to be able to calculate phonon DOS from first principles.
Materials Studio can produce phonon dispersion and DOS charts from any .phonon CASTEP output file. This file is generated
with every CASTEP job that includes a calculation of Phonon Dispersion or Phonon DOS. The .phonon file is hidden, so you
will not see it in the Project Explorer.
When evaluating phonon DOS, use only the results of phonon calculations on the Monkhorst-Pack grid.
Now use the results of the previous calculation to create a phonon dispersion chart.
Ensure that Fe CASTEP GeomOp/Fe CASTEP Energy/Fe.xsd is the active document.
Select Modules | CASTEP | Analysis from the menu bar to open the CASTEP Analysis dialog. Select
Phonon dispersion from the list of properties. Ensure that the Results
file is Fe_PhonDisp.castep.
Select cm-1 from the Units dropdown list and
Line from the Graph style dropdown list.
Click the View button.
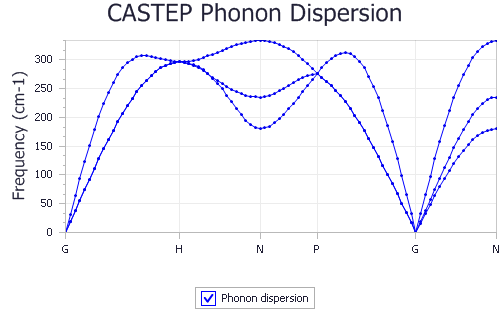
A new chart document, Fe Phonon Dispersion.xcd, is created in the results folder. It should be similar to the
chart shown below:
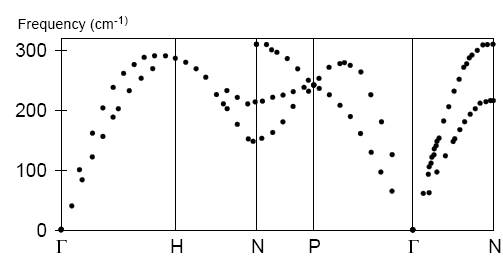
The experimental phonon dispersion (Minkiewicz et al., 1967) is shown below:
Overall, the accuracy of the calculation is qualitatively acceptable, better agreement with the experimental results will be obtained by running the calculation with a larger cutoff radius.
Now create a phonon DOS chart.
Make Fe.xsd the active document and select
Phonon density of states from the list of properties on the CASTEP Analysis dialog.
Ensure that the Results file is Fe_PhonDOS.castep.
Set Display DOS to Full. Click the
More... button to open the CASTEP Phonon DOS Analysis Options dialog.
Select Interpolation as the Integration method and
Fine as the Accuracy level. Click the OK button.
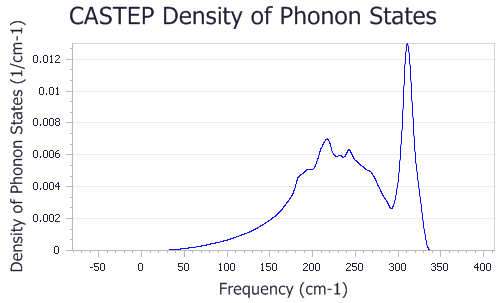
On the CASTEP Analysis dialog click the View button.
A new chart document, Fe Phonon DOS.xcd, is created. It should look similar to the chart shown below:
Phonon calculations in CASTEP can be used to evaluate the temperature dependence of the enthalpy, entropy, free energy, and lattice heat capacity of a crystal in a quasi-harmonic approximation. These results can be compared with experimental data (for example, heat capacity measurements) and used to predict phase stability of different structural modifications or phase transitions.
More details can be found in the Predicting the thermodynamic properties of germanium tutorial.
This is the end of the tutorial.
References
Minkiewicz, V. J.; Shirane, G.; Nathans, R. "Phonon Dispersion Relation for Iron ", Phys. Rev., 162, 528-531 (1967).