

Next: Scaling
Up: Bulk crystalline silicon
Previous: Electronic density
Contents
The converged value of the total energy agrees with the CASTEP value
(again with equivalent energy cut-off, Brillouin zone sampling and
pseudopotential) only within 3%. However, if energy differences are
caused by density-matrix variations which are short-ranged, then they will
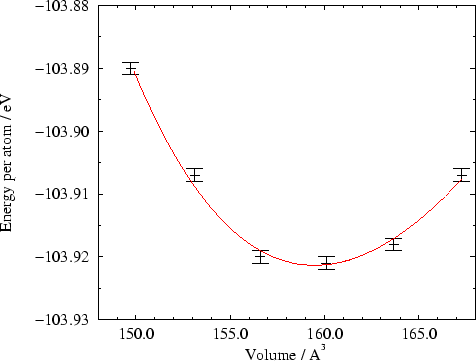
be much better converged than absolute energies. In figure 9.7
we plot the total energy against volume  . For a lattice parameter
 Å, which was used for the calculations in section
9.1.1, we used values of
 Å,
Å,
 Å and an energy cut-off of 200 eV.
As the volume
  was changed, the support region radius
 ,
density-kernel cut-off
  and energy cut-off
 were changed proportionally.
The parameters used are listed in table 9.1.
Table 9.1:
Parameters used to calculate energy-volume curve.
 / Å / Å |
 / Å / Å |
 / Å / Å |
 / Å / Å |
 / eV / eV |
| 5.31 |
149.72 |
3.03 |
5.87 |
209 |
| 5.35 |
153.13 |
3.05 |
5.91 |
206 |
| 5.39 |
156.59 |
3.08 |
5.96 |
203 |
| 5.43 |
160.10 |
3.10 |
6.00 |
200 |
| 5.47 |
163.67 |
3.12 |
6.04 |
197 |
| 5.51 |
167.28 |
3.15 |
6.09 |
194 |
|
Figure 9.7:
Energy-volume curve for silicon.
The line is the best fit to the Birch-Murnaghan equation of state.
|
Fitting the data to the Birch-Murnaghan equation of state allows values
for the equilibrium volume  and bulk modulus
  to be calculated, which are
compared with the results obtained from a CASTEP calculation using the
same pseudopotential and to experiment [174] in
table 9.2. Generally we expect to obtain lattice parameters to
within 2% and bulk moduli to within 10%. The bulk modulus is very sensitive
to the data, so that whereas the prediction of the lattice parameter is in
excellent agreement with both the CASTEP and experimental values,
the value of the bulk modulus predicted by the linear-scaling method is
about 8% too large. These results indicate that the linear-scaling
calculation is not quite fully converged with the set of parameters used,
but are very encouraging overall.
Table 9.2:
Comparison of calculated and experimental data for silicon.
| Calculation |
Linear-scaling |
CASTEP |
Experiment |
 / Å / Å |
5.423 |
5.390 |
5.430 |
 / Å / Å |
159.47 |
156.56 |
160.10 |
 / GPa / GPa |
108.8 |
101.7 |
100.0 |
|


Next: Scaling
Up: Bulk crystalline silicon
Previous: Electronic density
Contents
Peter D. Haynes
1999-09-21
![]() . For a lattice parameter
. For a lattice parameter
![]() Å, which was used for the calculations in section
9.1.1, we used values of
Å, which was used for the calculations in section
9.1.1, we used values of
![]() Å,
Å,
![]() Å and an energy cut-off of 200 eV.
As the volume
Å and an energy cut-off of 200 eV.
As the volume ![]() was changed, the support region radius
was changed, the support region radius
![]() ,
density-kernel cut-off
,
density-kernel cut-off ![]() and energy cut-off
and energy cut-off
![]() were changed proportionally.
The parameters used are listed in table 9.1.
were changed proportionally.
The parameters used are listed in table 9.1.
![\includegraphics [width=12cm]{ev.eps}](img1181.gif)
![]() and bulk modulus
and bulk modulus ![]() to be calculated, which are
compared with the results obtained from a CASTEP calculation using the
same pseudopotential and to experiment [174] in
table 9.2. Generally we expect to obtain lattice parameters to
within 2% and bulk moduli to within 10%. The bulk modulus is very sensitive
to the data, so that whereas the prediction of the lattice parameter is in
excellent agreement with both the CASTEP and experimental values,
the value of the bulk modulus predicted by the linear-scaling method is
about 8% too large. These results indicate that the linear-scaling
calculation is not quite fully converged with the set of parameters used,
but are very encouraging overall.
to be calculated, which are
compared with the results obtained from a CASTEP calculation using the
same pseudopotential and to experiment [174] in
table 9.2. Generally we expect to obtain lattice parameters to
within 2% and bulk moduli to within 10%. The bulk modulus is very sensitive
to the data, so that whereas the prediction of the lattice parameter is in
excellent agreement with both the CASTEP and experimental values,
the value of the bulk modulus predicted by the linear-scaling method is
about 8% too large. These results indicate that the linear-scaling
calculation is not quite fully converged with the set of parameters used,
but are very encouraging overall.