Displaying thermodynamic properties
Phonon calculations in CASTEP can be used to evaluate the temperature dependence of the energy, entropy, free energy and lattice heat capacity of a crystal in a quasiharmonic approximation. These results can be used to compare with experimental data (for example on heat capacity measurements), to predict phase stability of different structural modifications, and so on (see Baroni et al., 2001). Warren et al. demonstrated applicability of CASTEP to theoretical studies of phase transitions (Warren and Ackland, 1996 and Warren et al., 1998).
An example of the CASTEP output for thermodynamic properties is shown in Figure 1. All energy-related properties are plotted on one graph, and the calculated value of the zero-point energy is included. The heat capacity is plotted separately on the right.
The entropy is presented as an S*T product to allow comparison with the energy.
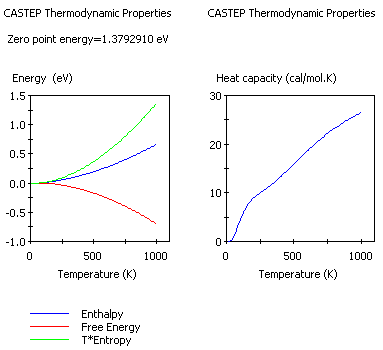
Figure 1. Thermodynamic properties of MgH2
Thermodynamic properties calculated using the quasiharmonic approximation can be inaccurate for temperatures comparable to the Debye temperature.
To create a thermodynamic properties chart
- Choose Modules | CASTEP | Analysis from the Materials Studio menu bar.
- Select Thermodynamic properties from the list of properties.
- Use the Results file selector to pick the appropriate results file (it should have a PhonDOS suffix).
- Optionally, check Plot Debye temperature.
- Select the desired temperature range.
- Click the View button.
- A new chart document, seedname Thermodynamic Properties.xcd, is created in the results folder.
- If Plot Debye temperature is checked, an additional chart document, seedname Debye Temperature, is created in the results folder.
- Optionally, click the Assign temperature factors to structure button to add temperature factor information to the structure.
See Also:
Thermodynamic calculations
Analyzing CASTEP results
Thermodynamic properties selection - CASTEP Analysis dialog
Results file selector