INSTRUCTIONS FOR DAY 2, EXERCISE 1
Ethanol
The discovery that one could actually see chemical shifts in hydrogen spectra was made in 1951 at Stanford University by Packard, Arnold, Dharmatti (shown in Fig 1). We will try to reproduce this result.
OBJECTIVES:
- Examine the convergence of the chemical shieldings with planewave cutoff
- Compare to experiment.
SCF Calculation
Today's inputs are in your home directory (the tar file should have an obvious name!) First run the scf calculation for ethanol. After this you should run the GIPAW calculation eg
pw.x < ethanol.scf.in > ethanol.scf.out
gipaw.x < ethanol.gipaw.in > ethanol.gipaw.out
- Look at the output file. At the end the isotropic chemical shielding, anisotropy, and asymmetry are reported (here we're only interested in the isotropic value.)
- Examine the effect of increasing the cutoff energy (say 20-90 Ryd in steps of 10 Ryd). It always helps to plot a graph of the convergence (eg with gnuplot or xmgrace on the cluster) You may want to try running the larger calculations in parallel
- Find the converged hydrogen (or proton in NMR language) shieldings. We will compare them to experiment. The three methyl (CH3) protons undergo fast exchange; they rotate faster than the nuclear magnetic moment processes. The magnetic moment will therefore see an average chemical shielding. The same is true of the CH2 protons.
- Average the CH3 and CH2 chemical shieldings. This will give you 3 unique chemical shieldings.
- We now need to convert the chemical shieldings to chemical shifts on the experimental scale. We use the relation: shift = reference - shielding A suitable ref for 1H is 30.97ppm.
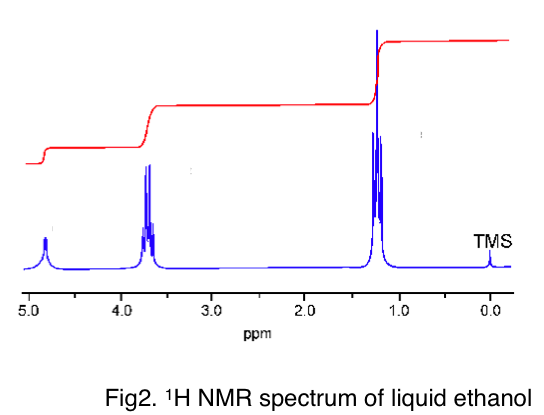
Fig 2 shows a modern high-resolution 1H spectrum for liquid ethanol. (note that the peaks are split due to J-coupling - the interaction of the 1H magnetic moments - but let's ignore that for now). The three peaks are roughly at 1.2ppm, 3.7ppm and 5ppm. You should find that your computed values agree for two sites. Do you know why the other site has such a large disagreement with experiment?