Displaying density of states charts
Density of states (DOS) and partial density of states (PDOS) charts give a quick qualitative picture of the electronic structure of a material and sometimes they can be related directly to experimental spectroscopic results.
If you have calculated DOS for a spin polarized system and
the total spin is not optimized two charts will automatically be displayed, <seedname> DOS Alpha.xcd and
<seedname> DOS Beta.xcd.
Full density of states
Materials Studio can produce DOS plots from any .bands CASTEP output file. These files are hidden in the Project Explorer but a
.bands file is generated with every .castep file. All the files that can be used in the analysis of the current
calculation will be presented in the results file selector. However, it is recommended that you create DOS
plots based on the results of a band structure calculation that only uses k-points in high-symmetry directions.
When evaluating DOS, use only the results of eigenvalues calculations on the Monkhorst-Pack grid. If you have more than one such set of results, for example, DOS and Optics, select the one with the highest density of k-points, that is, the highest Monkhorst-Pack mesh parameters.
To create a DOS chart
- Choose Modules | CASTEP | Analysis from the Materials Studio menu bar.
- Select Density of states from the list of properties.
- Use Results file selector to pick the right results file.
- Select Full to display the total DOS.
- For spin-polarized calculations, select the required DOS component from the DOS display dropdown list.
- Specify the Function to use, either DOS or Integrated DOS.
- Optionally, click the More... button to open the CASTEP DOS Analysis Options dialog. Set the Integration method and other options, Interpolation gives more accurate results than the Smearing method, although it is slightly slower.
- Click the View button.
- A new chart document,
seedname DOS.xcd, is created in the results folder.
Partial density of states
Materials Studio produces PDOS plots for certain angular momenta on selected atoms. The Sum curve represents the local density of states (LDOS) when one atom is selected. If more than one atom is selected, the contributions in each angular momentum channel from all selected atoms are added together. When no atoms are selected the behavior is the same as if all atoms were selected.
PDOS analysis formalism is not valid for high energy states in the conduction band: PDOS representation will usually decay to zero at about 20 eV above the Fermi level. This is related to the fact that expansion of essentially free electron states in terms of a limited number of atomic-like basis functions is impossible to carry out with any degree of accuracy. Only the valence band and lower part of the conduction band are meaningful in the PDOS plot.
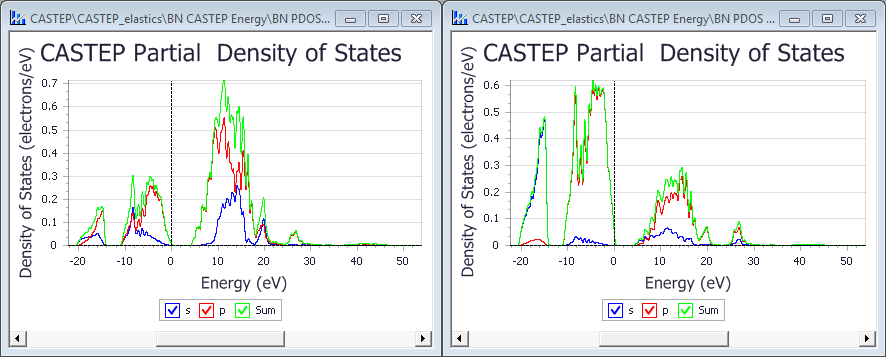
Figure 1. PDOS for BN. The left window is for boron, the right for nitrogen.
To create a PDOS chart
- Choose Modules | CASTEP | Analysis from the Materials Studio menu bar.
- Select Density of states from the list of properties.
- Use Results file selector to pick the right results file.
- Select Partial to display the partial DOS.
- Check the required angular momentum components for the PDOS.
- Select the atom or atoms in the model, for which the PDOS is to be created.
- For spin-polarized calculations, select the required DOS component from the DOS display dropdown list.
- Optionally, set additional CASTEP DOS analysis options. The Interpolation Integration method gives more accurate results than the Smearing method, although it is slightly slower.
- Click the View button.
- A new chart document,
seedname PDOS.xcd, is created in the results folder.
You should rename this file to indicate the atoms on which it is based. In the
example above (see Figure 1) suitable names for the two files created might be BN N PDOS.xcd and
BN B PDOS.xcd (the default names are BN PDOS.xcd and BN PDOS (2).xcd).
See Also:
Phonon density of states
Density of states and partial density of states
Analyzing CASTEP results
Density of states selection - CASTEP Analysis dialog
Results file selector
CASTEP DOS Analysis Options dialog