Displaying band structure charts
Band structure charts show how electronic energies depend on k-vector, along high symmetry directions in the Brillouin zone. These charts provide a useful tool for qualitative analysis of the electronic structure of a material, for example, it is easy to identify the narrow bands of d and f states as opposed to the free electron like bands that correspond to s and p electrons. It is also instructive to look for directions with relatively flat, dispersionless bands, as these directions are likely to contribute strongly to optical absorption. Thus, allowing explanation of the anisotropy of optical properties. The energy band gap is also easily deduced from the band structure plots as it normally corresponds to the energy difference between two states at high symmetry points.
An example of the CASTEP output for band structure is shown in Figure 1. Electronic states with different spins are presented using different colors and the Fermi level is shown with the dashed line. All energies are relative to the Fermi level (or to the top of the valence band in the case of insulators or semiconductors). The labels along the X axis of the band structure graph correspond to the standard definitions of high symmetry points for the given lattice type (Bradley and Cracknell, 1972). The Γ-point is denoted by a G.
The density of states included in this plot was created using Interpolation as an Integration method and Alpha and Beta as the DOS display.
If you have calculated DOS for a spin polarized system with a non-zero initial spin and
the total spin is not optimized two charts will automatically be displayed, <seedname> Band Structure Alpha.xcd and
<seedname> Band Structure Beta.xcd.
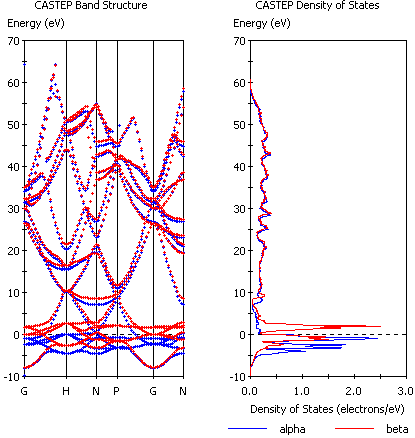
Figure 1. Band structure with DOS for Fe (spin-polarized GGA calculation).
To create a band structure chart
- Choose Modules | CASTEP | Analysis from the Materials Studio menu bar.
- Select Band structure from the list of properties.
- Use Results file selector to pick the appropriate results file (it should have a BandStr suffix).
- Select a required display style (Points or Lines) from the Graph style dropdown list.
- Optionally, check Show DOS and set the relevant DOS options.
- Click the View button.
- A new chart document, seedname Band Structure.xcd, is created in the results folder.
See Also:
Analyzing CASTEP results
Displaying density of states charts
Band structure selection - CASTEP Analysis dialog
Density of states selection - CASTEP Analysis dialog
Results file selector