Disorder in solids
Many crystal structures possess static positional disorder. The crystal may either contain fewer atomic species than there are crystallographically equivalent sites to populate, or there might, for example, be statistical occupancy of a given crystallographic site by more than one type of atom in different unit cells. This positional disorder is typically manifested in site occupancy factors of less than unity for the average unit cell.
Materials Studio allows you to model positional disorder by specifying atom occupancy and by defining mixture atoms.
Atom occupancy
The vast majority of atoms will have an occupancy of unity. However, in the case of an atom on a partially occupied interstitial position, you can specify an occupancy ranging from 0.0 to 1.0.
Atom occupancies can be modified in the Properties Explorer.
Mixture atoms
Atomic sites in a crystal can also be described in terms of a hybrid atom that consists of two or more element types. The relative concentrations can be set for any number of atoms, but the total concentration must not exceed 100%. The mixture atoms description is the most often used representation of solid solutions, metallic alloys, disordered minerals, and so on.
Disorder and first principles calculations
There are a number of different approaches for dealing with disorder in first principles calculations:
- Virtual crystal approximation (VCA): this offers technically the simplest approach, allowing calculations on disordered systems to be carried out at the same cost as calculations for ordered structures. VCA ignores any possible short range order and assumes that on each potentially disordered site there is a virtual atom which interpolates between the behavior of the actual components. This approach neglects such effects as local distortions around atoms and cannot be expected to reproduce the finer details of the disordered structures very accurately.
- Using large ordered supercells followed by configurational averaging: this is a very expensive approach with limited applicability. For example, it is not possible to treat arbitrary and particularly small concentrations.
- Coherent potential approximation (CPA): this method approximates a configurationally random alloy with an effective medium that is determined self-consistently from the condition of stationary scattering. The CPA technique is used extensively with model Hamiltonians with well-known scattering properties or in the context of multiple scattering methods of band structure calculation (KKR, LMTO). CPA is not well suited to total energy calculations or geometry optimization tasks.
- "Computational alchemy": this method uses the perturbation theory to calculate the response to the difference between the true and VCA potentials. This approach is very demanding computationally, as are all linear response calculations.
The basic ideas of the workable VCA implementation for DFT methods, in particular for the pseudopotential-based techniques, were set out by Bellaiche and Vanderbilt (2000). The main statement for the implementation of VCA with ultrasoft potentials can be expressed as:

where the total external potential is generated as the sum of the nonlocal potentials of each atomic species, α, taken with the weights, w, of the component atoms in the mixture atom. This means that all the key components of the ultrasoft potentials, that is, the local part, Vloc, and the D and Q matrices, are all weighted according to the site occupancies.
The VCA scheme described above has been applied successfully to study disorder in the perovskites Pb(ZrTi)O3 (Bellaiche and Vanderbilt, 2000) and BiScO3-PbTiO3 (Iniguez et al., 2000), and Al-Si disorder in silicates such as hollandite and gehlenite (Winkler et al., 2002).
Ramer and Rappé (2000) suggested an alternative scheme where the pseudopotentials are generated on the fly for the mixture atoms. Their scheme appears to be less readily generalized for the case of more than two disordered species or where the mixture atom's components have different chemical valences.
Limitations of VCA implementation in CASTEP
The VCA approach is not intended as a universal method for conducting studies of disordered materials. It often produces useful results, but it is important to be aware of its limitations.
Theoretical limitations
VCA is not expected to be better than 50% accurate for excess properties of solid solutions, even for the applications that use simple forcefields. The deviation from the Vegard law, for example, can only be reproduced qualitatively for many systems. In fact, CASTEP calculations for NaCl/KCl mixtures with norm-conserving potentials fail to describe even the shape of the excess volume curve (the difference between the calculated volume at a given concentration and the linear combination of the volumes of the end-members). It should be noted that the excess properties are very sensitive to the accuracy of the data for the end-members and, in general, this is not the preferred application of VCA in CASTEP. On the other hand, properties such as the bulk modulus of the NaCl/KCl solid solution are described very well within the same framework (see Figure 1).
An important aspect of the VCA implementation has not been discussed by the authors of the formalism (Bellaiche and Vanderbilt, 2000). One should always test the pseudopotentials for the presence of ghost states. They often manifest themselves in the solid state calculations as a strong change in the total energy as a function of the energy cutoff of the plane wave basis set. It seems that the ultrasoft potentials are prone to generating ghost states in the VCA framework, while none of the individual potentials has a ghost state. The NaCl/KCl system could not be studied with the ultrasoft potentials for this very reason - the finite basis set correction calculated for solid solutions was orders of magnitude higher than for the end-members. This is a clear indication of a ghost state in the calculation. There is no easy way of testing the VCA approach for ghost states, so one should always examine the value of the derivative of the total energy as displayed in the output file during the finite basis set correction calculation. It should be of the same order as the derivatives for the end-member structures.
Technical limitations
Atom occupancy cannot be used with the current CASTEP implementation of the virtual crystal approximation (VCA). Partial atom occupancy can be considered as a special case of a mixture atom, where one part of the mixture is an atom of "nothing". This case is not supported for a number of technical and fundamental reasons.
Current implementation of the molecular dynamics algorithms in CASTEP is not yet compatible with the VCA formalism. None of the MD schemes (NVE, NPT, and so on) works for disordered crystals in the current version.
Linear response calculations (phonons, polarizability) are not supported for disordered crystals.
Test results
The VCA implementation in CASTEP is capable of correctly describing a number of mixture atoms, as shown by the results below.
Bulk modulus of NaCl/KCl solid solution
The bulk modulus of the halite-sylvite mixture (NaCl/KCl) has been calculated as a function of concentration by calculating the P-V equation of state for different Na concentration and fitting them with the third-order Birch-Murnaghan analytical expression. The results agree with the experimental data (Figure 1) to better accuracy than is typically achieved for the ordered crystals. The norm-conserving pseudopotentials were used in this study (all other tests described below were carried out with ultrasoft pseudopotentials).
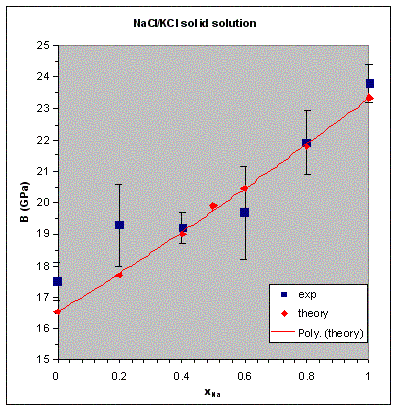
Figure 1. Dependence of the bulk modulus of the NaCl/KCl solid solution on concentration.
Experimental data are from Walker et al. (2004). The solid line shows a polynomial fit to the calculated
results.
The structure of bicchulite
The structure of the cubic mineral bicchulite, Ca2[Al2SiO6](OH)2, was calculated and compared to the experimental results (Sahl, 1980). Each Si/Al site is completely disordered in this structure, so the weights are 2/3 and 1/3 for Al and Si atoms, respectively. The lattice parameter is calculated as 8.675 Å, or 1.7% lower than the experimental value. The interatomic distances calculated for the structure are (Si,Al)-O = 1.6968 Å (-1.1%) and Ca-O = 2.3009 Å (-0.4%) and 2.3794 Å (-3.2%). This level of accuracy in the structural description is acceptable for a DFT calculation.
The structure and stability of Pb(Zr,Ti)O3 perovskites
The structures and energies of three different modifications of the 1:1 PZTO ceramics were calculated and the results compared with the experimental data and the earlier VCA results (Ramer and Rappé, 2000). The modifications studied include tetragonal P4mm and rhombohedral R3m and R3c phases. The results are summarized in the tables below.
Table 1. Structure of the P4mm tetragonal phase of PZTO. Experimental data are from Frantti et al. (2000), earlier VCA results are from Ramer and Rappé (2000).
| a (Å) | c (Å) | c/a | Tiz | O1z | O2z | Pb-O2 (Å) | Ti-O1 (Å) | Ti-O2 (Å) | |
|---|---|---|---|---|---|---|---|---|---|
| CASTEP | 4.0481 | 4.1283 | 1.020 | 0.5573 | 0.6112 | 0.0926 | 2.600 | 1.918 | 2.036 |
| exp. | 4.0303 | 4.1449 | 1.028 | 0.5649 | 0.6110 | 0.0921 | 2.508 | 1.960 | 2.024 |
| VCA | 3.9760 | 4.1050 | 1.033 | - | - | - | - | - | - |
Table 2. Structure of the R3m rhombohedral phase of PZTO. Experimental data are from Amin et al. (1981), earlier VCA results are from Ramer and Rappé (2000).
| a (Å) | α (°) | Ox | Oy | Pbx | Tix | Pb-O (Å) | Ti-O (Å) | |
|---|---|---|---|---|---|---|---|---|
| CASTEP | 4.0749 | 89.535 | -0.0040 | 0.5080 | 0.5586 | 0.0250 | 2.516 | 1.973, 2.115 |
| exp. | 4.0809 | 89.676 | -0.0046 | 0.5092 | 0.5620 | 0.0216 | 2.537 | 1.994, 2.098 |
| VCA | 4.0215 | 90 (fixed) | - | - | - | - | - | - |
Table 3. Structure of the R3c rhombohedral phase of PZTO. Experimental data are from Jirak and Kala (1988), earlier VCA results are from Ramer and Rappé (2000).
| a (Å) | α (°) | Ox | Oy | Oz | Pbx | Tix | Pb-O (Å) | Ti-O (Å) | |
|---|---|---|---|---|---|---|---|---|---|
| CASTEP | 5.7726 | 59.589 | 0.4942 | 0.0284 | -0.0180 | 0.0283 | 0.2632 | 2.565 | 1.979, 2.111 |
| exp. | 5.8240 | 59.600 | 0.4860 | 0.0330 | -0.0190 | 0.0341 | 0.2620 | 2.487 | 2.024, 2.109 |
| VCA | 5.6790 | 60 (fixed) | - | - | - | - | - | - | - |
Table 4. Energy differences between the three phases of PZTO, in meV per 5 atom cell. Earlier VCA results are from Ramer and Rappé (2000).
| E(R3m) - E(P4mm) | E(R3c) - E(P4mm) | |
|---|---|---|
| CASTEP | -4.7 | -6.3 |
| VCA | 9 | 6 |
These results indicate that the structural features are reproduced quite accurately within VCA. Note that the experimental data for rhombohedral phases are for Zr concentrations slightly different from 0.5, since these phases are not stable for the 1:1 composition. The energy differences between the phases are extremely small in recent studies and earlier work by Ramer and Rappé (2000). DFT energies cannot be trusted at this level of accuracy to judge the relative stability of the polymorphs. For example, the fact that the angles were fixed to 90 and 60° in the earlier VCA work suggests that after the full optimization, the rhombohedral phases are likely to become more stable than the tetrahedral phase, in agreement with the CASTEP results (Table 4).
The structure of leucite
Tetragonal leucite, KAlSi2O6, contains three different sites with a fully disordered distribution of Al and Si cations. The structure is only slightly distorted with respect to the cubic cell and the accuracy of reproduction of this distortion is a measure of the quality of the VCA description. The results presented below (Table 5) show exceptionally good agreement with the experimental data. Furthermore, atomic positions are also predicted very accurately. The highest deviation from the experimental data for any individual fractional coordinate is 0.001 in the CASTEP calculations, compared with maximum deviations of up to 0.007 in the forcefield modeling.
Table 5. Lattice parameters of leucite compared to experimental data (Mazzi et al., 1976 ) and the results of forcefield calculations (Winkler et al., 1991).
| a (Å) | c (Å) | c/a | |
|---|---|---|---|
| CASTEP | 13.1497 | 13.8318 | 1.052 |
| exp. | 13.09 | 13.75 | 1.050 |
| empirical | 12.9884 | 13.8000 | 1.062 |
See Also:
Disorder
Creating and editing mixture atoms
Changing atom occupancy